Power Query Combination (a query procedure) allows users to create tables with a unique set of records with all the possible combinations from a group of lists. Even though there is no single function that performs this operation, in this post I will explain how you can create a combined table with a few easy steps.
Building a table with unique combinations is an effective way to capture information. By considering all the possible combinations, users can fill the value for the records they need and not miss any detail.
In my journey in FP&A I’ve used this technique to capture the input of sales forecasts of a list of products, for different customers. I’ve used this methodology as my beginning block to a full financial forecast.
Business Case
Suppose you are assigned to build a table with combinations of school supplies, class and school, to calculate the number of units required.
This table will be filled out by a group users, and you have to guarantee it contains all the combinations so that they can insert the required number of units to specific records.
For this case we will consider the following group of lists when calculating our table:
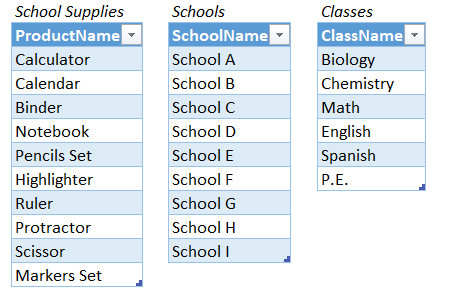
If we count the number of unique observations per list, we get the following results:
- 9 schools
- 6 classes
- 10 school supplies
Before jumping into Power Query, we need to quickly validate the exact number of records (rows) our table will have. This number is obtained by performing a product of the observations: 9 * 6 * 10 = 540
Power Query Combination
Now we can jump right into Power Query:
Step 1: Organize your tables
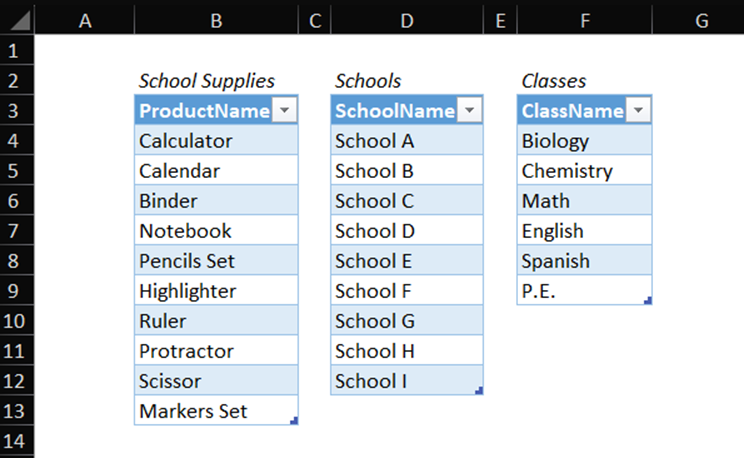
Organize your tables on a sheet side by side and name them. In this case we will use: “SchoolSupplies”, “Schools” and “Classes” for the tables. After naming them, you can proceed to import them to Power Query.
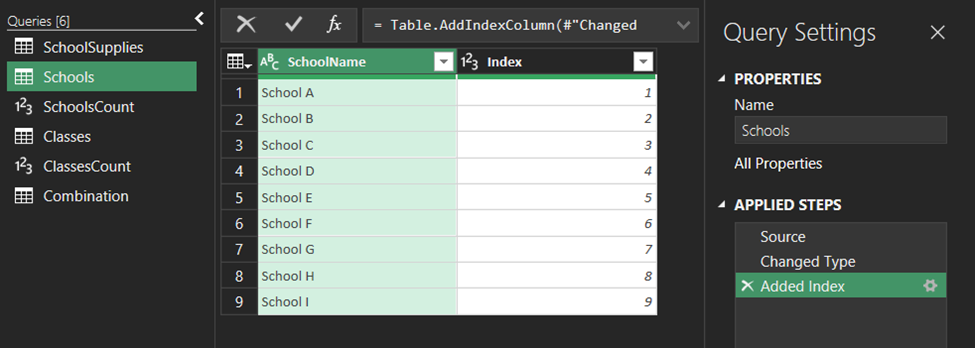
Step 2: Complementary tables
For the combination to work, you will need to do the following operations before getting into the main combination query:
- Add an index starting from one to the “Schools” table
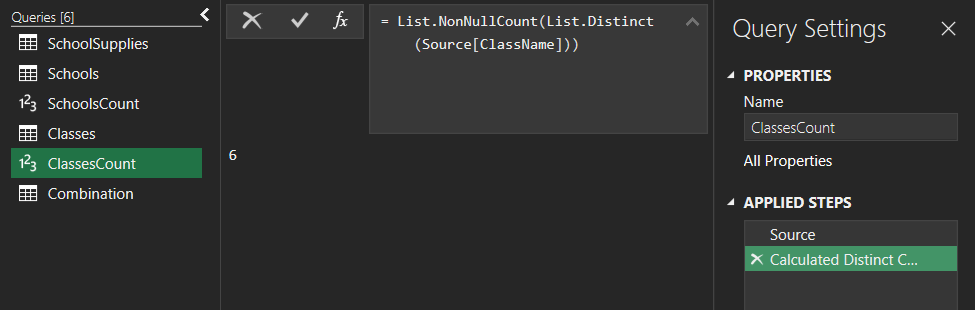
- Create a new query referencing the “Schools” table, rename the table to “SchoolsCount” and transform this query with a statistical operation > then count distinct values. You should get the number of observations in the table so it should be a single value of 9.

- Repeat the first and second step with the “Classes” table.

Step 3: Combination Query
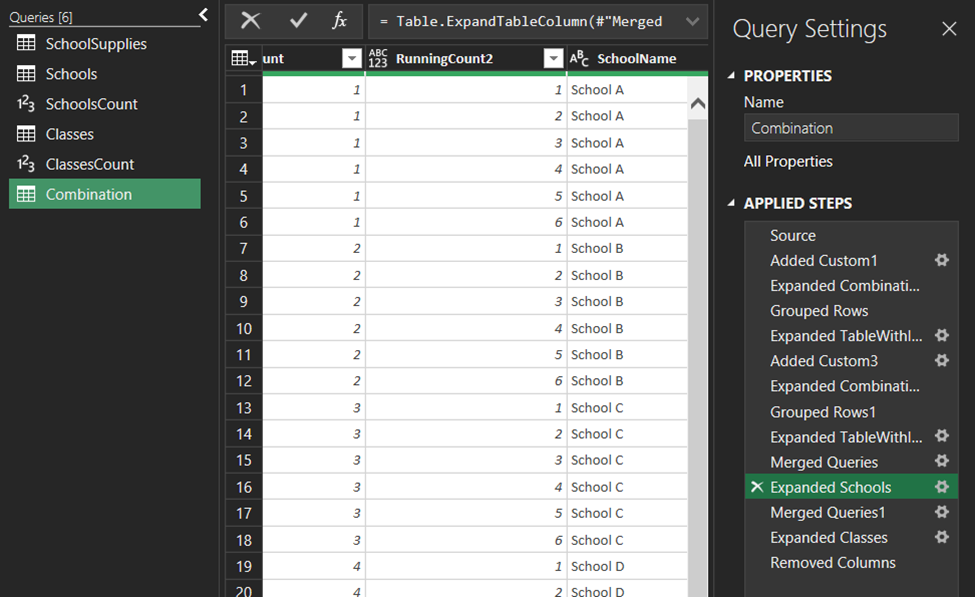
The Combination Query is a sequence of steps that first expand the records of the “SchoolSupplies” (first) table by the number of observations in the “Schools” (second) table and then create an acceding sequence of indexes with a maximum number equal to the number of unique observations on the table. These steps are repeated for the “Classes” table.
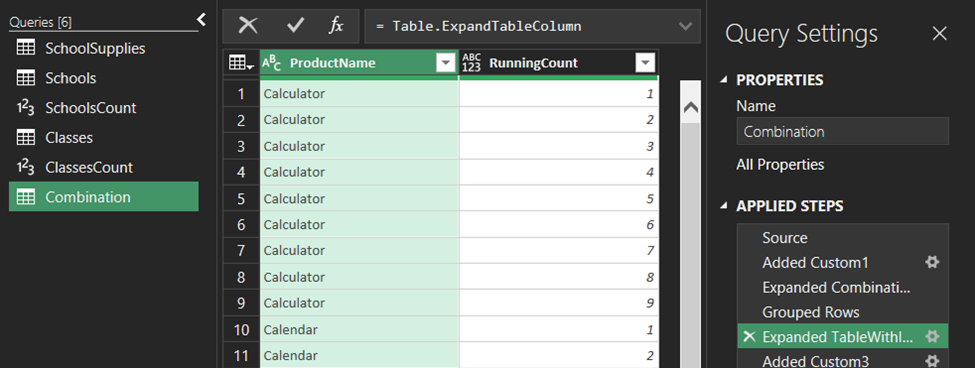
Once the query has the correct number of rows, it merges the index of each table with the correct text description. This is why we needed to at an index key starting from one to the original tables “Schools” and “Classes”.
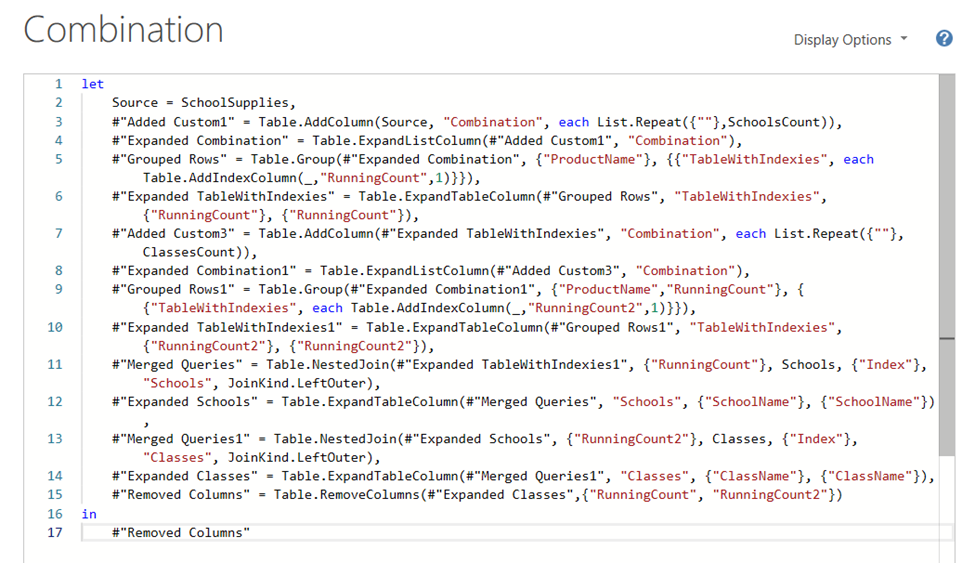
This is how the query looks like:
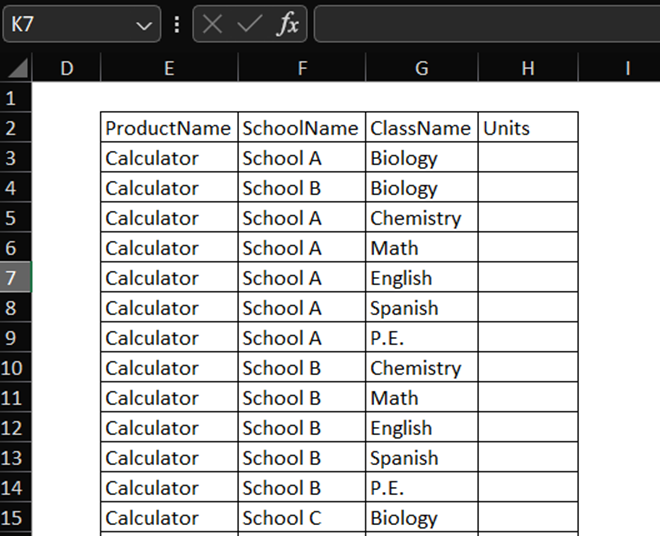
Step 4: Run the query and organize your table:
After running the query, the next step is to paste the table on a separate sheet and create a column for the input values (units’ column). With this table, your team will be able to complete the input values and return the table for further analysis.
Final Thoughts
As you can see it is very easy to create a table with all the combinations of a group of lists. In this case we only had to deal with 540 rows, but image it was more than 50,000. Also, if you need to update the number of observations in any table, you can do so without having to modify the Queries.
If you liked this article, please consider subscribing to my mailing list below. If you want to explore my articles in Power Query click on the following Link.